When the accounting department looks into the quality management, there are two identifiable and different types of costs related to this area: “Costs of Good Quality” and “Costs of Poor Quality”.
The Costs of Poor Quality is related to the efforts spent in order to maintain the quality standard, process consistency, and product conformance. Some examples include prevention costs, such as inspection and test materials, measurement equipment and resources maintenance.
On another hand, the costs of non-quality (or non-conformance) are those “internal and external costs resulting from failing to meet requirements”. Rework and delays are good examples of internal costs and complaints and warranties are external costs.
To manage the Costs of Quality is a classic “trade-off” situation. So, the million-dollar question is:
How can costs be minimized while still ensuring your product will satisfy your clients?
Unfortunately, this is a challenging question to answer in a single blog post. However, I would like to introduce a quality management tool that could be a great “kick-off” for better decisions:
FMEA: Failure Mode and Effects Analysis
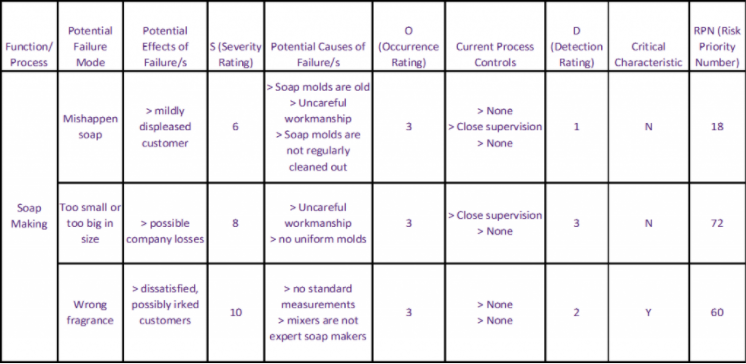
The main goal of FMEA is identifying potential failures and their impact. This is a simple qualitative tool with a huge potential for prioritizing project concerns and the job to be done to guarantee the product’s minimum requests.
One of the beauties of FMEA is that it can easily be used in other situations besides product manufacturing. For example, events and service management.
FMEA is usually done in a simple spreadsheet. In the first column, you should list what you want to analyze: product functions, items, or process. In the following column, you should add the possible failures related to the previous column item. In the third one, you write the potential impact of each failure. After completing this first step, it’s time to start to prioritize the failures.
Using Criteria to Prioritize
A “Risk Priority Number” (RPN) is created to prioritize failures. This number is a result of a multiplication of three criteria. Set a number from 1 to 10 (1= low and 10= high) for each following criteria:
1) The severity of the effect on the customer
2) The likely frequency of the problem, and
3) How easily the problem can be detected.
The following table can help you to understand the rating system:
 Once you have all the failure RPNs created, then rank the failures in a decreasing order. Now, you are able to see which failures and problems could have the most severe consequences. The first items on the list must be your priority concern.
There is no rule for choosing how many items you should have in your first “maximum attention” list. However, the Pareto rule is a great statistics tool for that purpose; Understanding that generally 80% of your problems will be related to 20% of the root causes. Therefore, 20% of all your failures is a good number for prioritizing.
Taking Action
Obviously, your problems won’t be solved just listing them in a logical order. For that, you must take your main problems and think about what could be done to prevent the main failures.
It’s time to take action! If you have trouble to find the cause of your problems, I suggest reading Mathias’ blog post: Grow and Improve Your Business With “Design Thinking”
 If you would like to discuss these ideas further or learn how we can help your business, please reach out to us: vinicius@thebusinesstherapist.com
Resources:
https://www.isixsigma.com/implementation/financial-analysis/cost-quality-not-only-failure-costs/
https://www.isixsigma.com/tools-templates/fmea/quick-guide-failure-mode-and-effects-analysis/


